UNDERSTAND
Understanding is continuous and foundational to climate adaptation work. Knowing more about climate change science, how your system functions along with its underlying conditions and key vulnerabilities, provides valuable context to assess future risks and opportunities for adaptation actions. Leading practices in the UNDERSTAND action area illustrate ways to facilitate better understanding.
In the UNDERSTAND action area, leading practices include:
- Invest in understanding climate science
- Explore how extremes might change in the future
- Value simple vulnerability assessments
- Foster sustained relationships with the climate science community
- Know your water system
- Think broadly about climate impacts
- Be a savvy consumer: recognize values and limits of climate science in practice
- Know your past climate conditions
- Recognize the value of long-term monitoring
![]()

Invest in understanding climate science
Climate change impacts to a water system vary considerably depending on where the system is located, how it is built and operated, and how far into the future impacts are considered. Investing the time and resources to understand the capabilities and limitations of climate science yields insights into how science should be applied and how climate change will impact your utility and provides a foundation for planning and preparing for those impacts.
Example: Learning about climate change science
Climate change science underlies our understanding of the impact climate change will have on our water systems. Knowing what the science says about local and regional temperature increases, precipitation changes, snowpack declines, and changes in streamflow timing can help you better navigate available climate information and how it might be useful in decision making.
WUCA has supported a series of regional two-day workshops; see Example: Learning together for details. A key element of the trainings is to help attendees become more savvy consumers by enhancing their understanding of the capabilities and limitations of climate science and learning best practices for using it in long-term water, wastewater, and stormwater utility planning.
See online materials and when future trainings will take place.
Example: Climate impacts for San Diego
As part of its 2015 Urban Water Management Plan update, the San Diego County Water Authority (SDCWA) develop downscaled climate change scenarios for its service area. SDCWA adopted a qualitative evaluation approach that uses a manageable number of climate change scenarios to develop a range of potential water demands. The development of demand forecasts based on alternative climate scenarios began by selecting Bias-Corrected Constructed Analog scenarios reflecting central tendencies and extremes of climate projections.
First, the temperature and precipitation dimensions were evaluated separately, ranking projected annual changes from smallest to largest and identifying the 95th, and 5th and 50th percentile values for each variable. Next, each "ideal" scenario was defined by a pairing– for instance, the warm/dry scenario might contain the 95th percentile value for temperature and the 5th percentile value for precipitation.
The final step of the scenario selection process involved the identification of individual model projections that have temperature and precipitation projections closest in value to the "ideal" scenario description (for example, the model projection that has a pairing of temperature and precipitation that is nearest the "ideal" 95th percentile temperature change and 5th percentile precipitation change). Model projections closest to "ideal" conditions were chosen as the representative climate change scenarios. Five scenarios were selected in this manner and used to prepare an ensemble of climate-change influenced demand projections for inclusion in SDCWA's Urban Water Management Plan.
SDCWA has also worked with the US Bureau of Reclamation to assess climate change impacts on surface water runoff for the San Diego region. In 2015, SDCWA partnered with the City of San Diego and the Bureau of Reclamation on the San Diego Basin Study (Basin Study). The purpose of the Basin Study was to determine potential climate change impacts on water supplies and demands within the San Diego region, and to analyze structural and non-structural concepts that can assist the region in adapting.
The Basin Study investigated potential changes to existing operating policies for regional water supply facilities (i.e., dams, reservoirs, conveyance facilities, and water treatment and water recycling plants), modifications to existing facilities, development of new facilities that could optimize reservoir systems, and additional new water supply options including desalination and indirect potable reuse options. The study performed a trade-off analysis that served as a valuable tool to compare the ability of Concepts (adaptation strategies) to achieve Evaluation Objectives (criteria developed through stakeholder input to characterize desired outcomes).
The analysis provided a relative ranking of Concepts determined by the specific set of Evaluation Objectives included, the data used to calculate performance measures, and the weights determined from a survey, and are intended to be used to screen promising Concepts rather than prioritize recommended approaches.
Example: Impacts to New York City's water supply
The Climate Change Integrated Modeling Project (CCIMP) was initiated in 2008 to evaluate the effects of future climate change on the quantity and quality of water in the New York City water supply. The CCIMP has addressed three issues of concern to NYC: overall quantity of water, turbidity, and eutrophication. Models are currently in development to simulate precursors of disinfection byproducts.
In the first phase of the project, an initial estimate of climate change impacts was made using available global climate model data sets and NYC Department of Environmental Protection's suite of watershed, reservoir, and system operation models. Initial results from the CCIMP suggest that streamflow would increase during the late fall and winter and decrease in spring due to a shift toward more rain and less snow, as well as earlier melting of the typically smaller snowpack that does develop.
The shifting seasonal pattern in streamflow could also result in increased turbidity in the fall and winter, but decreased turbidity in the spring. This information provides a foundation from which the impact of this shifting pattern is being evaluated to determine any changes to operating rules used to optimize water quality for the water supply.
Additional resources
Many organizations, tools, and reports can provide technical assistance, especially when exploring where to start and when you lack resources to hire a dedicated climate staff person or sponsor work. Trusted climate science partners, as described in UNDERSTAND: Foster sustained relationships with the climate science community, can help field questions and point you to local resources and opportunities for engagement. See Additional climate service resources for more information.
Discussing climate change impacts with other utilities in your region could be a great resource, as impacts and challenges may be similar; see Example: Regional communities of champions.
- The Dos and Don'ts for using climate information in water planning and management describe how to approach using climate information
- The WUCA PUMA report profiles four projects where utilities invested in understanding climate science
![]()
Explore how extremes might change in the future
Annual and long-term (e.g., 30-year) averages and trends are common in climate change impact assessments, while extremes like hurricanes and rapid-onset droughts, which are more challenging to simulate and less certain, are under-reported in assessments and reports because extremes are difficult to model. Considering how extremes could change gets people thinking outside of what is “normal” and helps them think through what-if scenarios.
Example: Weather whiplash in 2017
The 2017 water year was challenging for Tampa Bay Water. The year had one of the driest dry seasons (October to May) in a century followed by one of the most active hurricane seasons in a decade, with four named storms impacting the region. While the year ended up with above- normal rainfall, the intra-year variability was unlike anything seen before. One of Tampa Bay Water’s structures which typically functions as a water supply source by providing water to an offsite reservoir, also provides flood protection – although it cannot, because of water quality, do both simultaneously. Therefore, extreme dry conditions followed by flood operations all in the same year presented a unique challenge. Water quality and quantity were both important as flood operations changed river water quality and limited quantity available for surface water harvest. Recognizing this challenge, Tampa Bay Water launched a multi-year research project with the University of Florida's Water Institute to understand how extremes may change in the future and how those changes may translate into operational challenges to both water quantity and quality.
This work is currently underway through a three-year project expected to be completed along with the Tampa Bay Water's 2023 Master Water Plan update. Interim results will be shared as they become available.
Additional resources
The Center for Adaptation Science and Solutions led a 10-month Colorado River Conversations Scenario Planning process to explore extreme events.
![]()
Value simple vulnerability assessments
Exploring how a simple change in temperature and precipitation impacts water utility resources and functions offers a low-cost, quick, and informative mechanism to better understand system vulnerability. Simple assessments provide knowledge and help utilities gain insights necessary to build adaptive capacity.
Example: Vulnerability assessments in the Colorado Front Range
In 2008, Denver Water invited five other water utilities, the state of Colorado, the Western Water Assessment, the National Center for Atmospheric Research, Research Triangle International, and the Water Research Foundation to coproduce the Joint Front Range Climate Change Vulnerability Study (Front Range Study), to better understand how climate change may impact future water resources in Colorado. Together, the group explored potential future climate-informed hydrology and developed a thorough understanding of climate models, projections, climate assessments, and uncertainty. While the project was completed in 2010, Denver Water continues to convene the climate change group biannually to collaborate on new activities, learn about new science together, and learn from each other (see Example: Regional communities of champions).
The figure on the right depicts how annual temperature and precipitation conditions may change over time. What we learned from this scatter plot is that our region will continue to warm as greenhouse gases increase in the atmosphere. The exact amount our watersheds will warm over time is uncertain. Denver Water also learned that precipitation in our region may increase, indicated by all the dots above the red line, or it may decrease, shown by all the dots below the red line. There is not a consistent signal of how precipitation may change in our region. It was these scatter plot findings that most influenced Denver Water's climate assessment philosophy. We learned that modeling precipitation is incredibly complicated, that our region may not see model agreement for precipitation, and that there is significantly more skill and confidence in temperature projections.
Based on this, Denver Water shifted focus to warming (see next example).
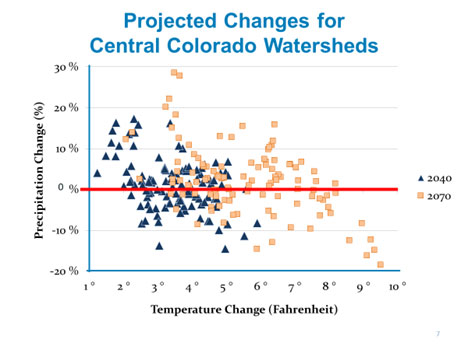
This figure illustrates how temperatures and precipitation are projected to change in the 2040s and 2070s using climate projections (BCSD CMIP3). Changes in temperature are plotted along the x-axis and percent changes in precipitation are plotted along the y-axis.
SOURCE: Front Range study
Example: Value from a simple temperature perturbation
Denver Water completed a simple assessment to examine the impacts of 5oF warming to our supply and demand. We found that our supply could decrease by 20%—that's 1/5 of our supply lost to warming alone, with no other changes—and our demand could increase 7%. This means that long-term warming is a significant vulnerability. This simple assessment was informative and proved to be an incredibly valuable mechanism in helping our utility understand and evaluate our vulnerability to climate change. Denver Water continues to use simple climate warming assessments to inform planning and resilience investments. Given the uncertainty and limited predictive skill of climate projections, simple is ideal.
![]()
Foster sustained relationships with the climate science community
Climate science continues to advance, providing new data, tools, and knowledge. Long-term relationships with those who study climate science and provide climate services can help you navigate what is new and relevant and help scientists focus on questions that matter to society. The relationship, how it is established and maintained, can vary, thus opportunities exist that span a range of needs and resources.
Example: A regional alliance
Climate science is quickly evolving—more computational resources, better measurements, and new techniques continue to advance the science. Keeping up with climate science is often challenging. To address this, Tampa Bay Water has prioritized connecting with researchers in universities across Florida. The utility participates in the Florida Water and Climate Alliance (FL-WCA), a statewide group focused on understanding how global-scale climatic conditions impact local-level decision making. FL-WCA is "a stakeholder-scientist partnership committed to increasing the relevance of climate science data and tools at relevant time and space scales to support decision-making in water resource management, planning and supply operations in Florida." FL-WCA has helped foster connections, prioritize relevant science, and helped build research-practice partnerships that have received considerable federal grant funds.
For more information on Tampa Bay Water's program, contact The Florida Water and Climate Alliance.
Example: A student program
For almost a decade, Tampa Bay Water has sponsored Ph.D. students to work for the utility, where they are oriented to the utility's tools and attend regular meetings. The student program allows for continuous connections with the university community, supports the growth of a workforce savvy in both utility needs and applied climate change science, and helps transfer knowledge from research to applications and build tools that are operated in-house.
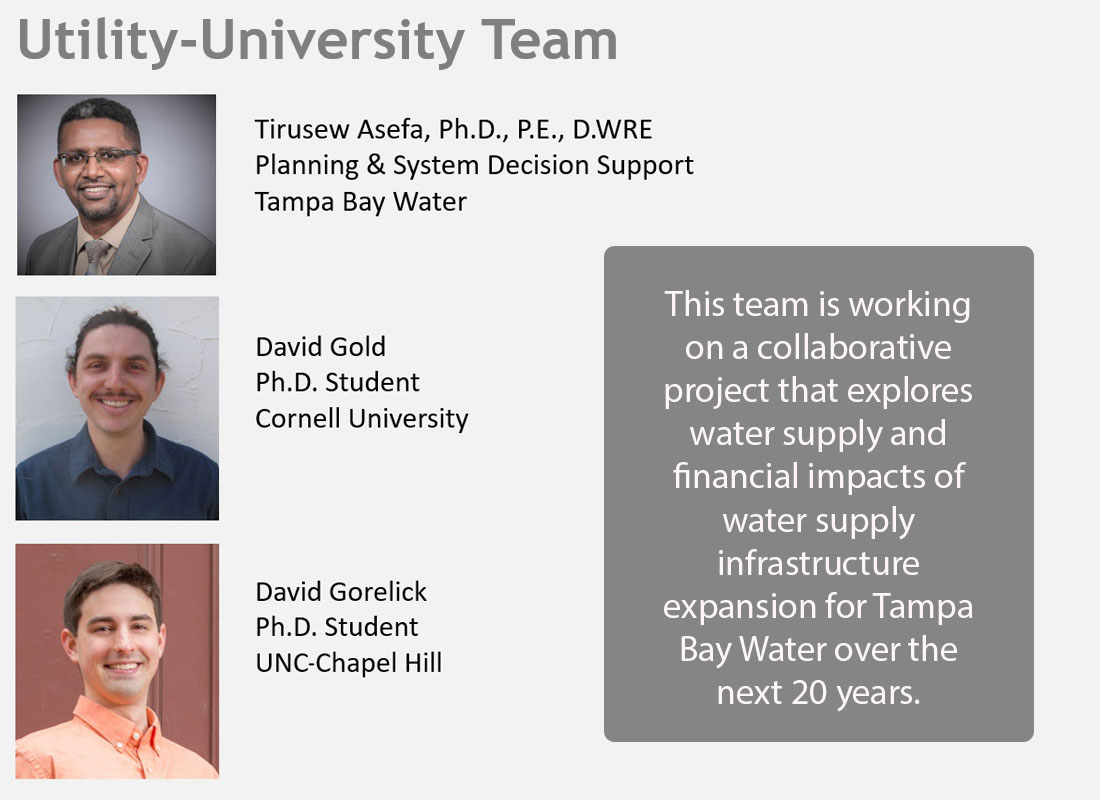
SOURCE: Tampa Bay
Example: Adding a partnering objective into one's business plan
San Diego County Water Authority's (SDCWA) 2017-2021 Business Plan contains a sustainability program that includes climate change management strategies focused on maintaining a leadership role in collaboratively advancing climate science research. A key objective of the climate change strategy is to partner with those doing leading-edge climate science to develop strategies in adaptation, sustainability, and resiliency. This has resulted in SDCWA partnering with the Scripps Institution of Oceanography's research arm, the Center for Western Weather and Water Extremes (CW3E).
SDCWA is a founding member of CW3E, which is focused on advancing understanding of atmospheric rivers and droughts to improve water management, mitigate flood risk, and increase water supply reliability. SDCWA has also collaborated with consultants and the Bureau of Reclamation to develop climate change-impacted demand and supply scenarios, as well as do evaluations of climate change impacts on surface water runoff (see UNDERSTAND: Invest in understanding climate science for more details).
Examples: Piloting Utility Modeling Applications (PUMA)
WUCA PUMA projects aimed to foster relationships, and many of the connections made remain strong today. As described in the final report on PUMA, "The PUMA project was an effort to produce actionable science through close collaboration between climate experts and utility personnel to meet the needs of four water utilities.
Instead of asking climate experts what they thought utilities should do regarding climate change, four WUCA utilities agreed to forge partnerships with scientific institutions to explore how to integrate climate considerations into their specific management context." Read the PUMA report.
Additional climate service resources
If you do not have adaptation staff or funding to work with researchers, these resources can help support your effort:
- Your local NOAA RISA Group
- Your regional USGS Climate Adaptation Science Center
- Your USDA Climate Hub
These types of "boundary organizations" exist to help connect researchers and practitioners at the regional level.
Several non-federal organizations that also focus on serving communities:
There are also tools, reports, and trainings that provide free technical climate science information, including (but not limited to):
- US Climate Resilience Toolkit
- US Climate Explorer
- National Climate Assessment
- National Center for Atmospheric Research resources
- Dos and Don'ts for using climate information in water planning and management
- State or local climate assessments or reports
- WUCA’s climate resilience trainings (See Example: Learning about climate change science.)
![]()
Know your water system
To better understand how your utility will be impacted by climate change, it is important to know your system: Where does your water come from? How does it move throughout the collection system? How is it stored? What are your utility’s key operations? What are its current underlying vulnerabilities? What interdependencies exist with other systems and across sectors (e.g., energy, transportation)? Knowing your system allows for a deep understanding of the factors that influence a system’s vulnerabilities and risks, including but not limited to climate change, and can help direct resources and inquiries more effectively.
Example: Understanding the managed raw water system
While understanding the natural system is fundamental to evaluating and estimating water supply and watershed health, it must go hand-in-hand with a nuanced knowledge of system operations, asset management, treatment and distribution, and customer water use. Denver Water approaches this in three parts: See it. Map it. Model it. Shadowing staff and taking system tours to learn the ins and outs of system management and functions, as well as to discuss the potential implications of climate change, allows for a more thorough system understanding while building important relationships with people throughout the organization.
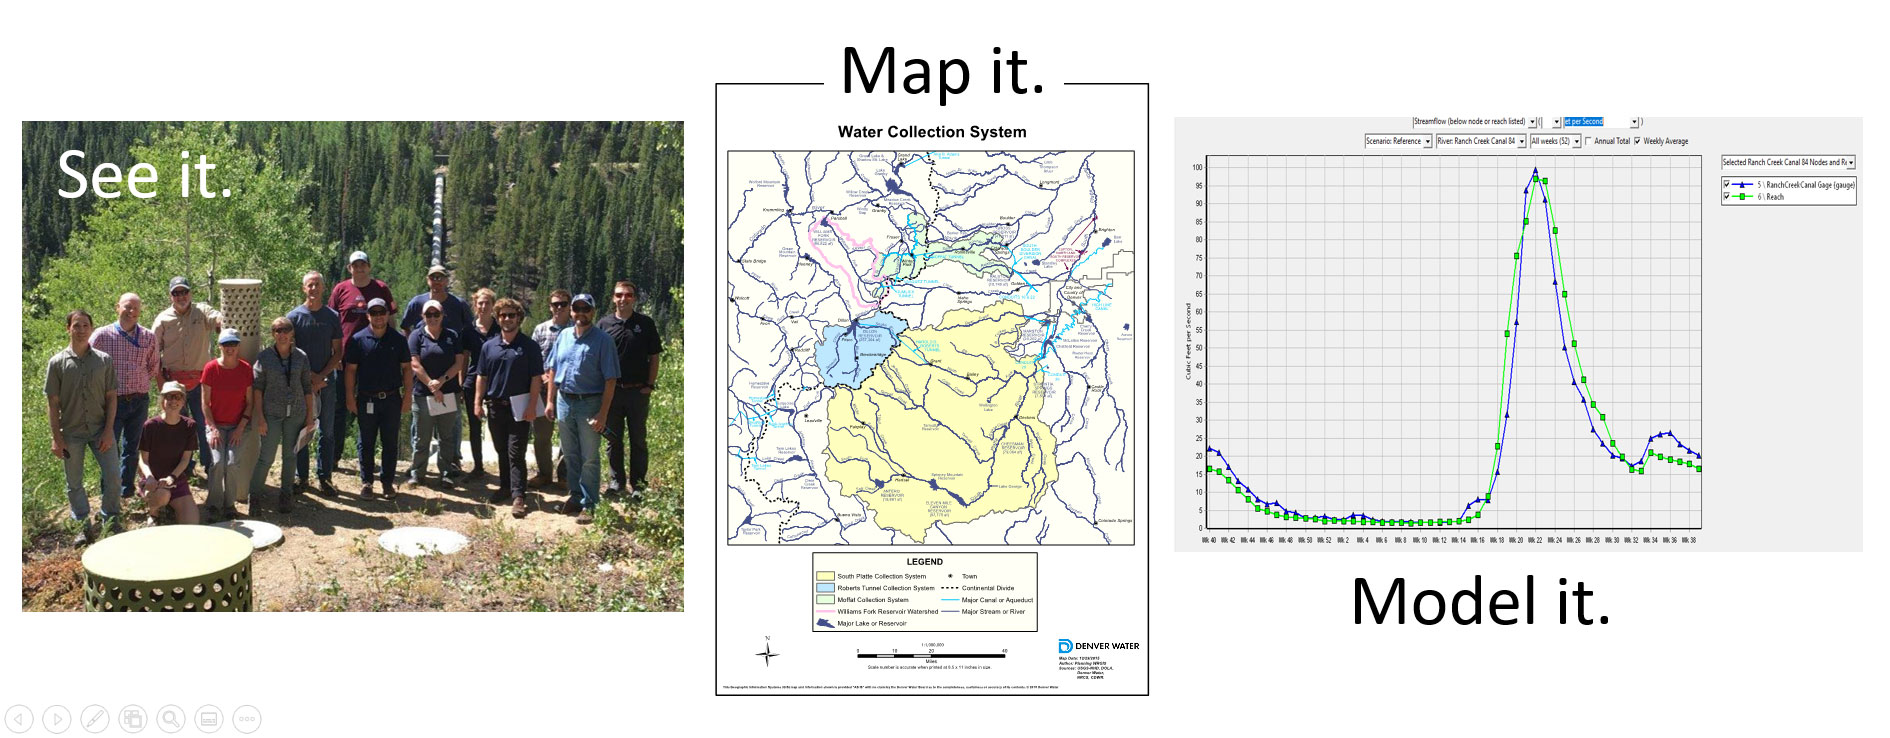
SOURCE: Denver Water
End-to-end system knowledge lets you more effectively identify and evaluate climate risks and cascading implications as well as identify adaptation solutions that are informed and scientifically based.
Example: Modeling the natural system
A better understanding of the natural system helps make sense of both how it may change and what those changes mean to the managed system. Denver Water's collection system is located in the headwaters of Colorado's high elevation mountain ranges and is primarily fed through snowmelt. Understanding the science of snow accumulation and melting, as well as the relationship with corresponding runoff, is key to skillfully forecasting runoff available for diversions and collection. Over the last decade, Denver Water has developed and employed the Water Evaluation And Planning (WEAP) hydrologic model to better understand the natural system supplying its streamflow functions and how that system might change as the climate continues to warm. Denver Water also uses the WEAP model to verify streamflow estimates made in the 1950s prior to the availability of topographic maps and watershed modeling.
The Portland Water Bureau has also built its understanding of the water system and future climate impacts using a hydrology model; learn more at Example: An in-house hydrology model.
Example: Vulnerability assessments
For a more holistic evaluation, Metropolitan Water District of Southern California (Metropolitan) is in the beginning stages of a Resources Vulnerability Assessment intended to identify relevant vulnerabilities for Metropolitan's resources and to characterize and assess qualitatively—based on technical information—the magnitudes of these vulnerabilities.
The assessment will include:
- Interviews with subject matter experts
- Research on vulnerability analyses done by Metropolitan and other local, regional, and federal agencies who impact Metropolitan
- Work to identify data gaps that need additional study
Example: Enterprise Risk Management
Southern Nevada Water Authority did an organization-wide risk analysis to understand the breath of risk; see PLAN: Take on climate change as another component of risk management for details.
Additional resources
If you are just getting started, Resilience Metrics has a useful overview of Climate Adaptation Basics, including short overviews and links to additional guidance on vulnerability assessments, climate risk assessments, and asset-based assessments.
![]()
Think broadly about climate impacts
Climate change is a risk multiplier that will create new, unexpected challenges. Utilities often focus on water quantity, but many other factors can affect water supply and public safety, including how extreme storms, flooding, sea level rise, extreme heat, extreme drought, low snowpack, fire, smoke, and wind, might impact water quantity, water quality, health and safety, risks to assets and built infrastructure, treatment processes, financial risks, etc. These can also cause other cascading impacts.
Example: Changes to a utility's risk profile
Every utility has a risk profile—a composite of all the organization's risks and all the actions the utility is taking to manage those risks. Southern Nevada Water Authority (SNWA) is addressing climate change through this lens and looking at how climate change could change its risk profile. The organization conducted an "enterprise-wide" risk assessment and flagged climate-sensitive risks. Working with staff across the organization, actions to mitigate the climate-sensitive risks were proposed. See PLAN: Take on climate change as another component of risk management for more detail.
Example: Workforce health
SNWA's risk profile evaluation (explained above) revealed that extreme heat could exacerbate risks to workforce health. Once identified, actions to reduce heat stress were enacted quickly, as described in IMPLEMENT: Recognize some adaptations can be employed quickly.
Example: Erosion and power loss
In 2012, Superstorm Sandy in New York City caused multiple impacts on water supply not directly related to flooding. For instance, high winds at one of the City's reservoirs resulted in shoreline erosion, causing high turbidity in the unfiltered water supply. While the City was able to maintain an uninterrupted water supply, power loss from the storm resulted in buildings losing the ability to pump to high floors. Therefore, while the City did not lose its supply of high-quality water, many New Yorkers lost access to water. Power loss also caused wastewater pumping stations to spill untreated sewage into New York Harbor. Following Sandy, there have been numerous efforts to mitigate similar impacts from future storms; see link below for more details on water and wastewater initiatives proposed to build a stronger, more resilient New York.
Example: Treatment process challenges
After presenting future projections of precipitation increases (described in ENGAGE: Consult expertise throughout your utility with purpose and regularity), operators of a Philadelphia Water Department wastewater treatment plant shared that future precipitation intensity increases would likely produce more trash, accumulating at faster rates, during the initial screening stage of the wastewater treatment process. This consequence, which was only identified after consulting with plant operators, has implications for resources—more staff and equipment may be needed to remove and process trash to maintain current levels of service.
Example: Risk-based strategic planning
The Portland Water Bureau took a risk-based approach to identify organizational risks for its five-year strategic plan. Climate change was identified as a high-priority organizational risk, especially in how it broadly impacts a range of utility functions and operations. The strategic plan’s climate change strategies, therefore, are focused not only on water supply and demand risks from climate change, but also on risks to the utility's outdoor workforce and the risk to the broader community, especially low-income and marginalized communities of color, of not mitigating carbon emissions. See Example: Concrete impacts of warming temperatures for more details.
![]()
Be a savvy consumer: recognize values and limits of climate science in practice
Climate science helps us better understand what we might expect from a warmer world (e.g., changes in temperature, precipitation, snowpack), but there are limits to what models can simulate and intrinsic uncertainties in future projections. Climate change information is created using models and methods that are more appropriate for certain questions than others. Use science to inform the process, but do not wait for nor expect climate change science to provide precise predictions.
Example: Sea level rise science in practice
In 2013, San Francisco Mayor Ed Lee directed City agencies to develop guidance for thinking about sea level rise (SLR) in developing the City's long-term capital plan investments. Step one in that process was understanding the state of sea level rise science. Because San Francisco's (and any city's) built infrastructure often has a life cycle of 75–100 years, and it was decided that asset life cycles should determine the range of resilience to seek in planning, long-term projections were needed.
The Sea Level Rise Committee quickly realized that a wide range of SLR scenarios existed; in one source, that range was 8 to 79 inches! (Read more at Example: Sea level rise science.) San Francisco's objective was not to artificially narrow those ranges to ease planning, but to work with them in thinking through adaptation planning.
To do this effectively, San Francisco has:
- Navigated a wide range of projections (read more at Example: Sea level rise science)
- Created planning guidance for City engineers (read more at Example: Sea level rise guidance)
- Moved forward with plans that incorporate a range of futures (read more at Example: Sea level rise projections)
Example: Robust Decision Making
Metropolitan Water District of Southern California uses robust decision making to understand the breadth of climate risk. As new best-available science or global climate models become available, these can be incorporated into this analysis framework, but decisions are not dependent on this information. See PLAN: Plan for a range of futures, not a single future for details.
Additional resources
Trusted climate science partners, as described in UNDERSTAND: Foster sustained relationships with the climate science community, can help field questions and point you to local resources to better understand appropriate uses and limits.
See Additional climate service resources for more information.
View the Dos and Don'ts for using climate information in water planning and management, which describe how to approach using climate information.
![]()
Know your past climate conditions
Understanding the past is crucial to better understanding the future. Even though climate is changing (stationarity is no longer an appropriate assumption), information about past climate conditions is essential to understanding the range of natural variability and how your system’s baseline is changing relative to what you have already experienced.
Example: Past analytical relationships provide insights into future change
Understanding how hydrological and water management variables have interacted in the past under different climatological conditions can help prepare for an uncertain future climate. Central Arizona Project (CAP) is working with the Desert Research Institute to develop an analytical tool that explores relationship trends in the historical record for key hydrological variables in the Colorado River Basin.
This tool explores whether current trends in temperature, precipitation, snowpack, Colorado River flow, and reservoir storage have occurred in the past and their condition and frequency of occurrence. The tool’s purpose is to provide water managers in the Colorado River Basin an easy approach to compare trends of hydrological variables with each other through retrospective analysis in time. Establishing a baseline understanding of how hydrological variables behaved in the past will help inform how they might behave in the future under an increasingly changing climate.
Example: Past sea levels inform future planning
The rate of sea level rise varies depending on your location, due to climatic and non-climatic factors—this is called relative sea level. If you live in a region where the land is rebounding, or uplifting, from the last glacial period, there might not be much or any observable sea level rise because the land is rising faster than sea levels.
Alternatively, if you live in a region where the land is subsiding, or sinking, due to glacial isostatic adjustment or the extraction of water, oil, and/or gas, then sea levels might be rising at a faster rate than the global average. Relative sea level rise and storm surge impacts are also affected by other complex local, regional, and global factors, such as coastal geology, land use changes, natural cycles like El Nino, storm patterns and ocean currents. Understanding baseline conditions and how these impacts have historically affected your local sea levels and storms can help you anticipate changes in the future.
New insights and an understanding of baseline conditions and trends can be uncovered by looking at the history of tides and storm tides in your location. NOAA provides publicly available tide level records and analysis for tide gauges around the United States on their Tides and Currents website.
When possible, NOAA provides relative sea level trends and extreme water level information (e.g., storm tide and storm surge information in the form of annual exceedance probabilities and return periods). They also allow users to download tide level data so further analysis can be performed. The Philadelphia Water Department analyzed its over-100-year tide level record to understand past rates of sea level rise, sea level rise trends over time, and the annual exceedance probability of different size storm tides.
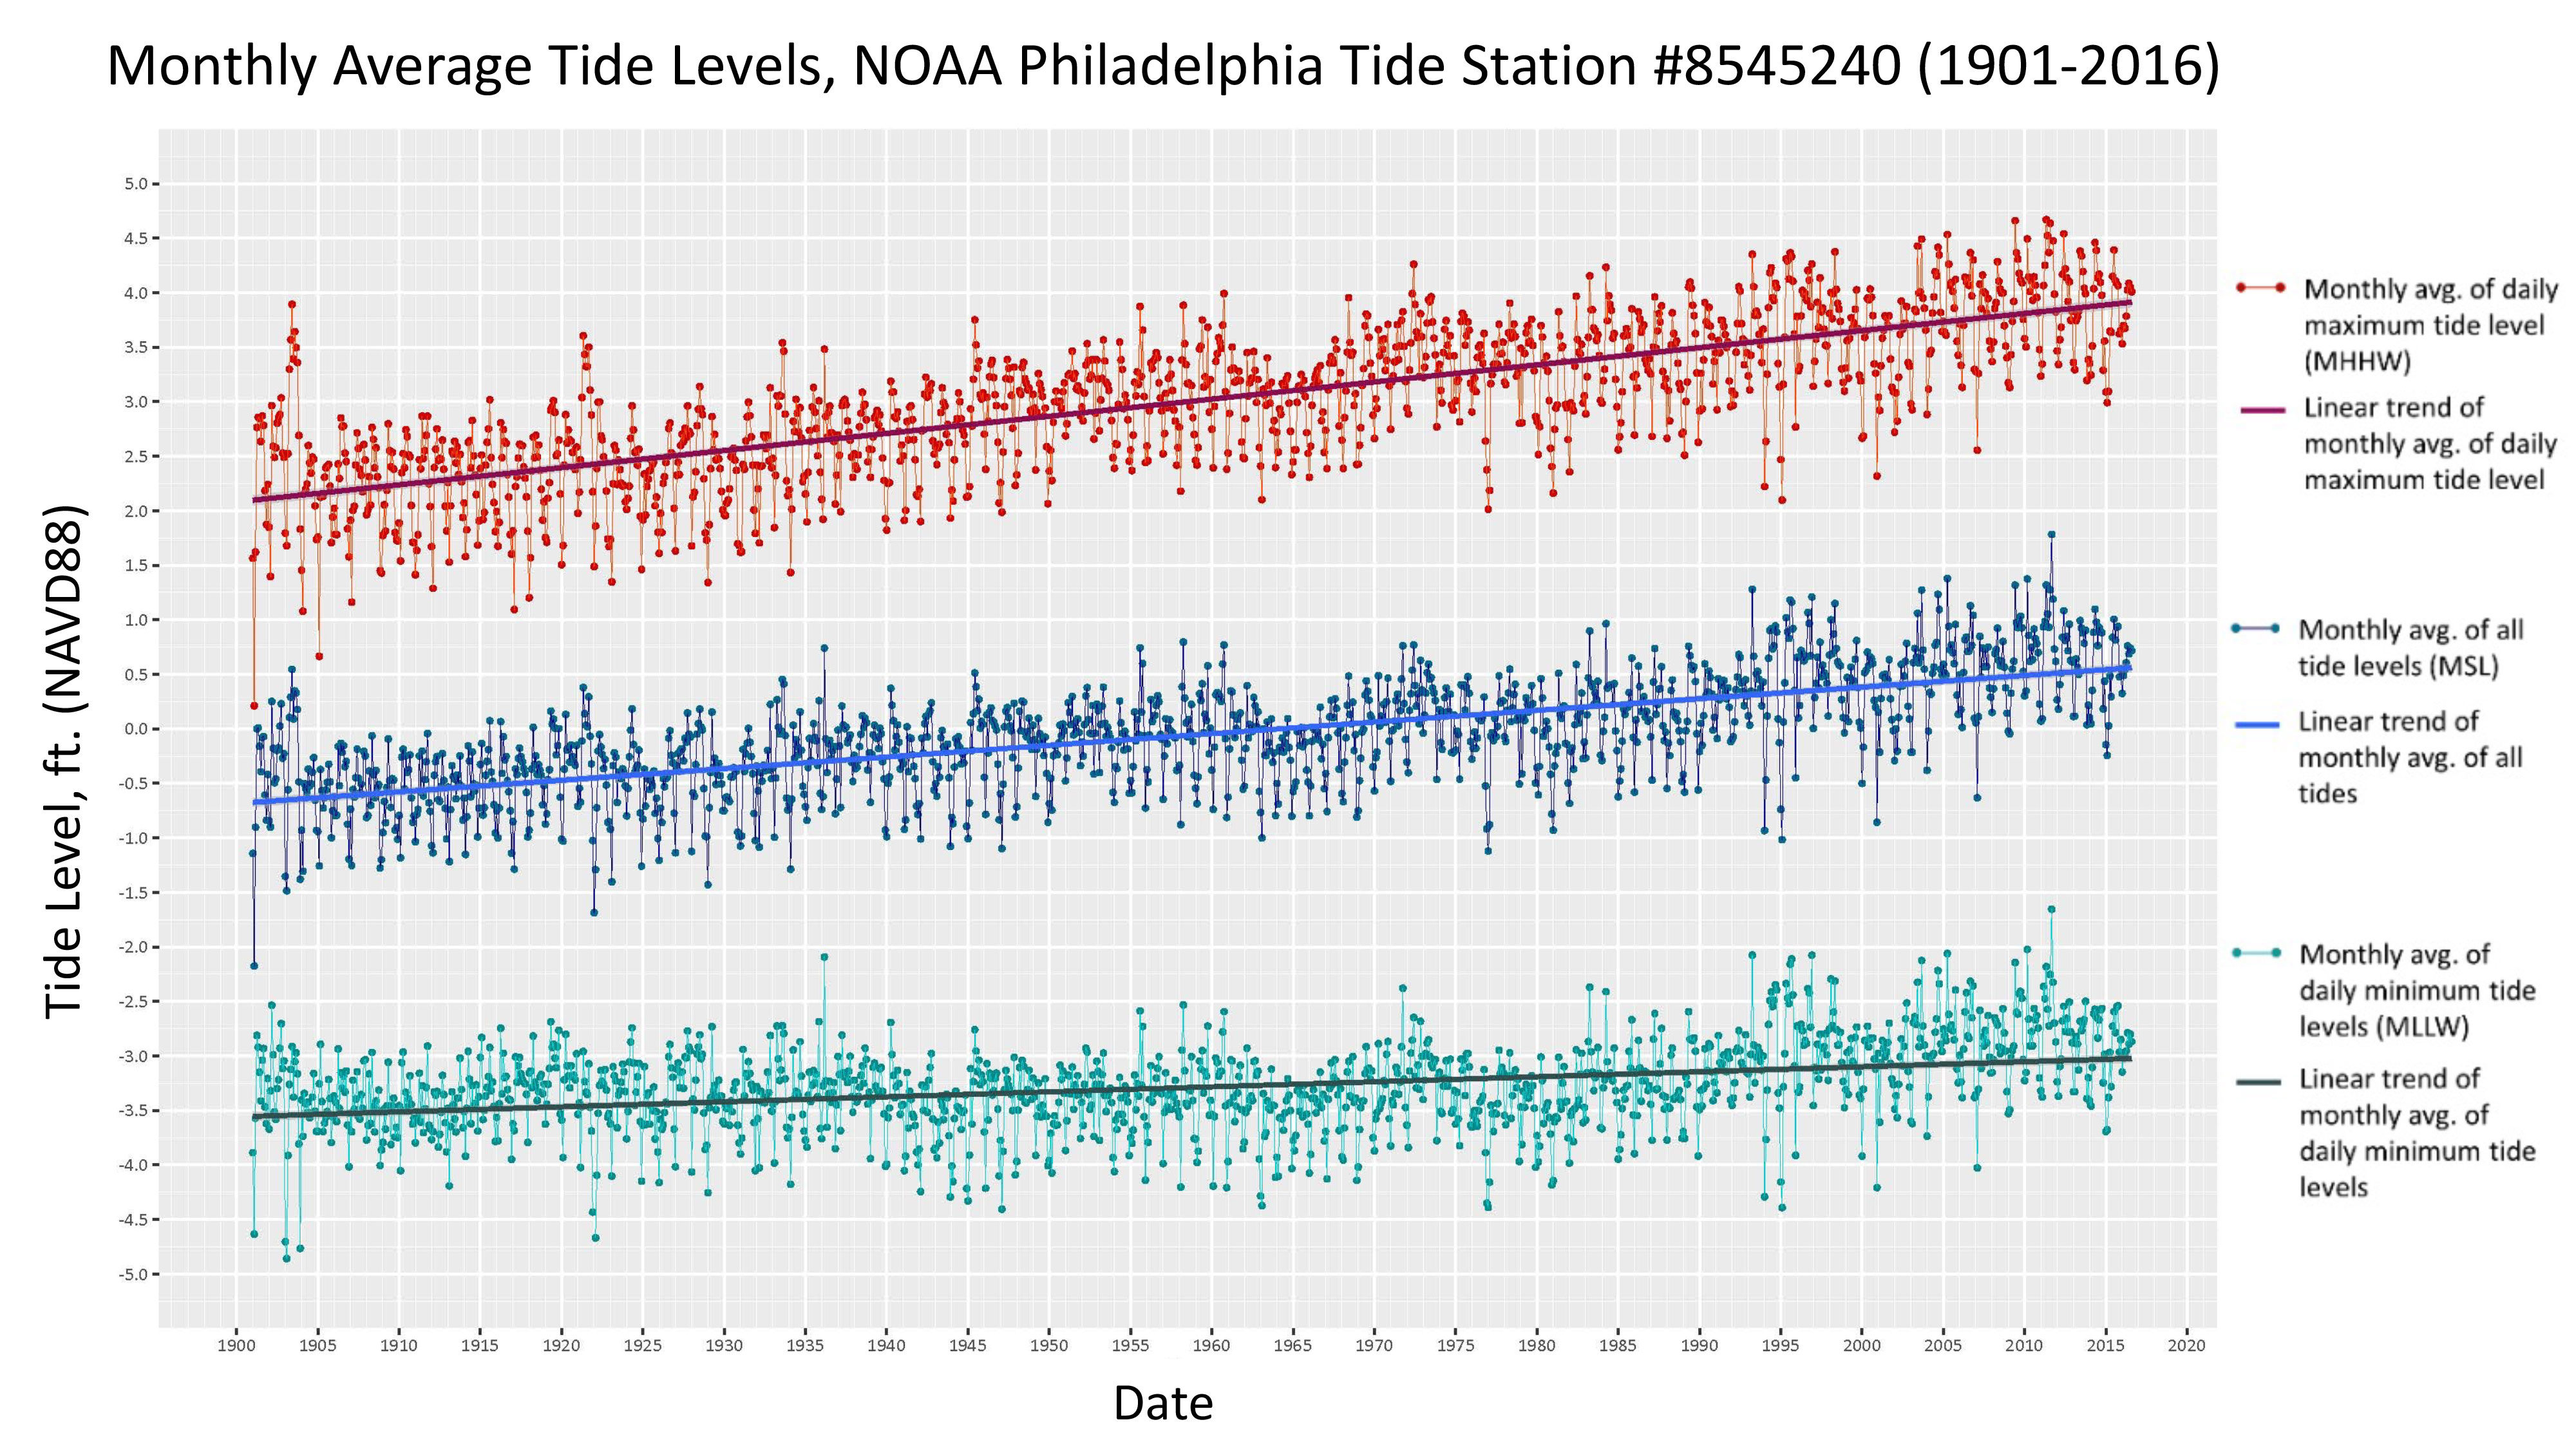
Analyzing the rate of sea level rise in Philadelphia over the period of record indicated that Philadelphia's rate of sea level rise is significantly higher than the global average. This is in part due to land subsidence, but taking a closer look at the data indicated that other factors were also involved. Examining the changing tidal range (the difference between high tide and low tide) revealed that some of the past sea level rise observed in Philadelphia was likely due to dredging of the Delaware river, filling wetlands, and other land use changes.
SOURCE: Philadelphia Water Department
Additional resources
If you do not have resources to do the analysis yourself, NOAA provides useful information for understanding past and current sea levels and extreme events. NOAA's Center for Operational Oceanographic Products and Services (CO-OPS) is the authoritative source for tides, water levels, currents, and other coastal oceanographic and meteorological information for the nation. The Tides and Currents website provides historic and real-time tide level data as well as predictions and analysis to understand conditions at tide stations along the US coast.
- On the Tides and Currents website, find the tide station nearest to your location and navigate to the station homepage. From there, the "Tides/Water Levels" tab provides relevant information if it is available, including downloadable tide level data, relative sea level trends and extreme water levels (e.g., storm tide and storm surge information in the form of annual exceedance probabilities and return periods).
- NOAA also publishes a report on high tide flooding and flood thresholds for locations in the national tide gauge network. As sea levels rise, the frequency of flooding caused by high tides—in the absence of a storm event—will increase. Flooding at high tide will become the new normal unless coastal flood mitigation strategies are implemented and could have huge implications for utilities with drainage systems. See more in the latest report (and look for updated reports in the future) 2019 State of U.S. High Tide Flooding with a 2020 Outlook.
Tips for working with tide level data: The height of the tides is determined by a complex set of factors related to the Earth, sun and moon and their orientation to one another as well as local conditions. The forces that influence the tides are well understood and predictions of the tide can be made with high accuracy. We know that there are natural cycles at play--seasonal, annual and multi-decadal—and those cycles must be accounted for (e.g., using long term averages) when working with tide level data. NOAA has several publications to help users work with tide level data, including the Computational Techniques for Tidal Datums Handbook.
Understanding sea level rise trends can be tricky and linear trends of noisy time series data must be used with caution. The trend rate is very sensitive to the start and end periods chosen and seasonal trends and other natural cycles must be accounted for before looking for a climate signal. If you have interest in statistically analyzing tide level data to look at trends, the following resources may be useful:
- Presentation by Brian McNoldy, Senior Research Associate, University of Miami on tidal variation and sea level rise trends (slides on trends begin with #14)
- Paper by Baart, Koningsveld and Stive (2012) Trends in Sea-Level Trend Analysis
Lastly, trusted climate science partners, as described in UNDERSTAND: Foster sustained relationships with the climate science community, can help field questions and point you to local resources, data sources, and guidance on how to use them.
![]()
Recognize the value of long-term monitoring
Long-term records can help an organization understand where trends are occurring and whether and when to make climate change-related investments. Becoming familiar with what data have been collected already and what environmental conditions and operational procedures should be monitored is time well spent. A defined baseline, in the context of other information, can help determine:
- What climate change information is appropriate for the region of interest
- If changes are occurring
- What changes are significant enough to pass a threshold that requires action
This requires understanding what has (or should) be monitored and then sustaining a monitoring effort, as highlighted in SUSTAIN: Monitor current conditions.
Example: An environmental baseline
As a utility starts adaptation work, effort must be made to ensure that the necessary data can be accessed (and if the data needed are not available, to establish a monitoring protocol to collect it). For example, when the Philadelphia Water Department Climate Change Adaptation Program (CCAP) began a risk assessment looking at the impacts of temperature increases to source water and drinking water quality, CCAP staff initially did not have access to the correct data reports. After gaining access to the correct databases, it became apparent that some of the information CCAP staff hoped to work with was simply not available or was incomplete (in this case, temperature readings throughout the treatment process).
When possible, resources should be allocated to collect the necessary data. When resources for additional monitoring or data collection are not available, the scope of the analysis may need to be revised to make the best use of accessible data. Environmental data from a neighboring municipality or weather station can sometimes serve as a proxy or help fill gaps in datasets that are incomplete.
Example: An operational baseline
Another lesson the Philadelphia Water Department (PWD) Climate Change Adaptation Program (CCAP) learned is that data collection needs to go beyond environmental parameters. Developing adaptation strategies often requires an understanding of operational conditions, procedures, and challenges.
For example, there is often no standard or specific requirement for post-storm documentation at treatment facilities. Therefore, the valuable institutional knowledge about exposure and vulnerability during extreme events is not consistently captured and easily shared for broader planning and risk management. The CCAP plans to work with PWD Operations staff to help capture and document operational challenges and solutions.
Example: Monitoring supply and demand conditions for long-term planning
The Portland Water Bureau (PWB) is developing situational monitoring indicators for assessing how hydrologic, supply, demand, and economic conditions are changing over time to make decisions and implement actions related to the bureau's 50-year Supply System Master Plan (2021).
The Bureau is planning for a range of future water supply, climatic, and economic conditions, but is also monitoring how things are changing on the ground in regular increments of time (annually, with a more detailed review and forecast every five years). Monitoring includes trends in streamflows, timing of reservoir drawdown, groundwater aquifer reliability, and actual customer water demand.
Example: Precipitation patterns
When the Philadelphia Water Department (PWD) began working with global climate model (GCM) output and analyzing precipitation projections, it became clear that GCMs do not accurately simulate rainfall patterns at the spatial and temporal resolution needed for PWD risk assessments. Specifically, GCM output simulates a "drizzle effect" in Philadelphia (i.e., many days with small rainfall amounts, similar to what one thinks of as London's weather). In reality, Philadelphia experiences flashy, intense rainstorms, especially during the summer months.
Understanding current conditions shaped PWD's methods and approach to its precipitation-related analyses. A considerable amount of work was done to develop a method that preserves local precipitation patterns from the observed record while still using GCM output to inform future increases in precipitation intensity and volume.
This example illustrates a common challenge: GCMs are designed to simulate average global changes that do not capture local precipitation characteristics well. There are, however, methods, like PWD's, that translate global change information into more local-scale impacts. These are described in WUCA's climate resilience trainings: Example: Learning about climate change science and in the papers highlighted below.
- American Society of Civil Engineers (ASCE) paper on the method used by PWD to transform GCM precipitation output for use in hydrologic and hydraulic modeling
- Consortium for Climate Risk in the Urban Northeast (CCRUN) webinar highlighting the methods PWD developed to transform GCM precipitation output for use in hydrologic and hydraulic modeling
- CCRUN webinar that highlights "A Practical Stochastic Weather Generator for Exploring Variability in Projected Precipitation Time Series"
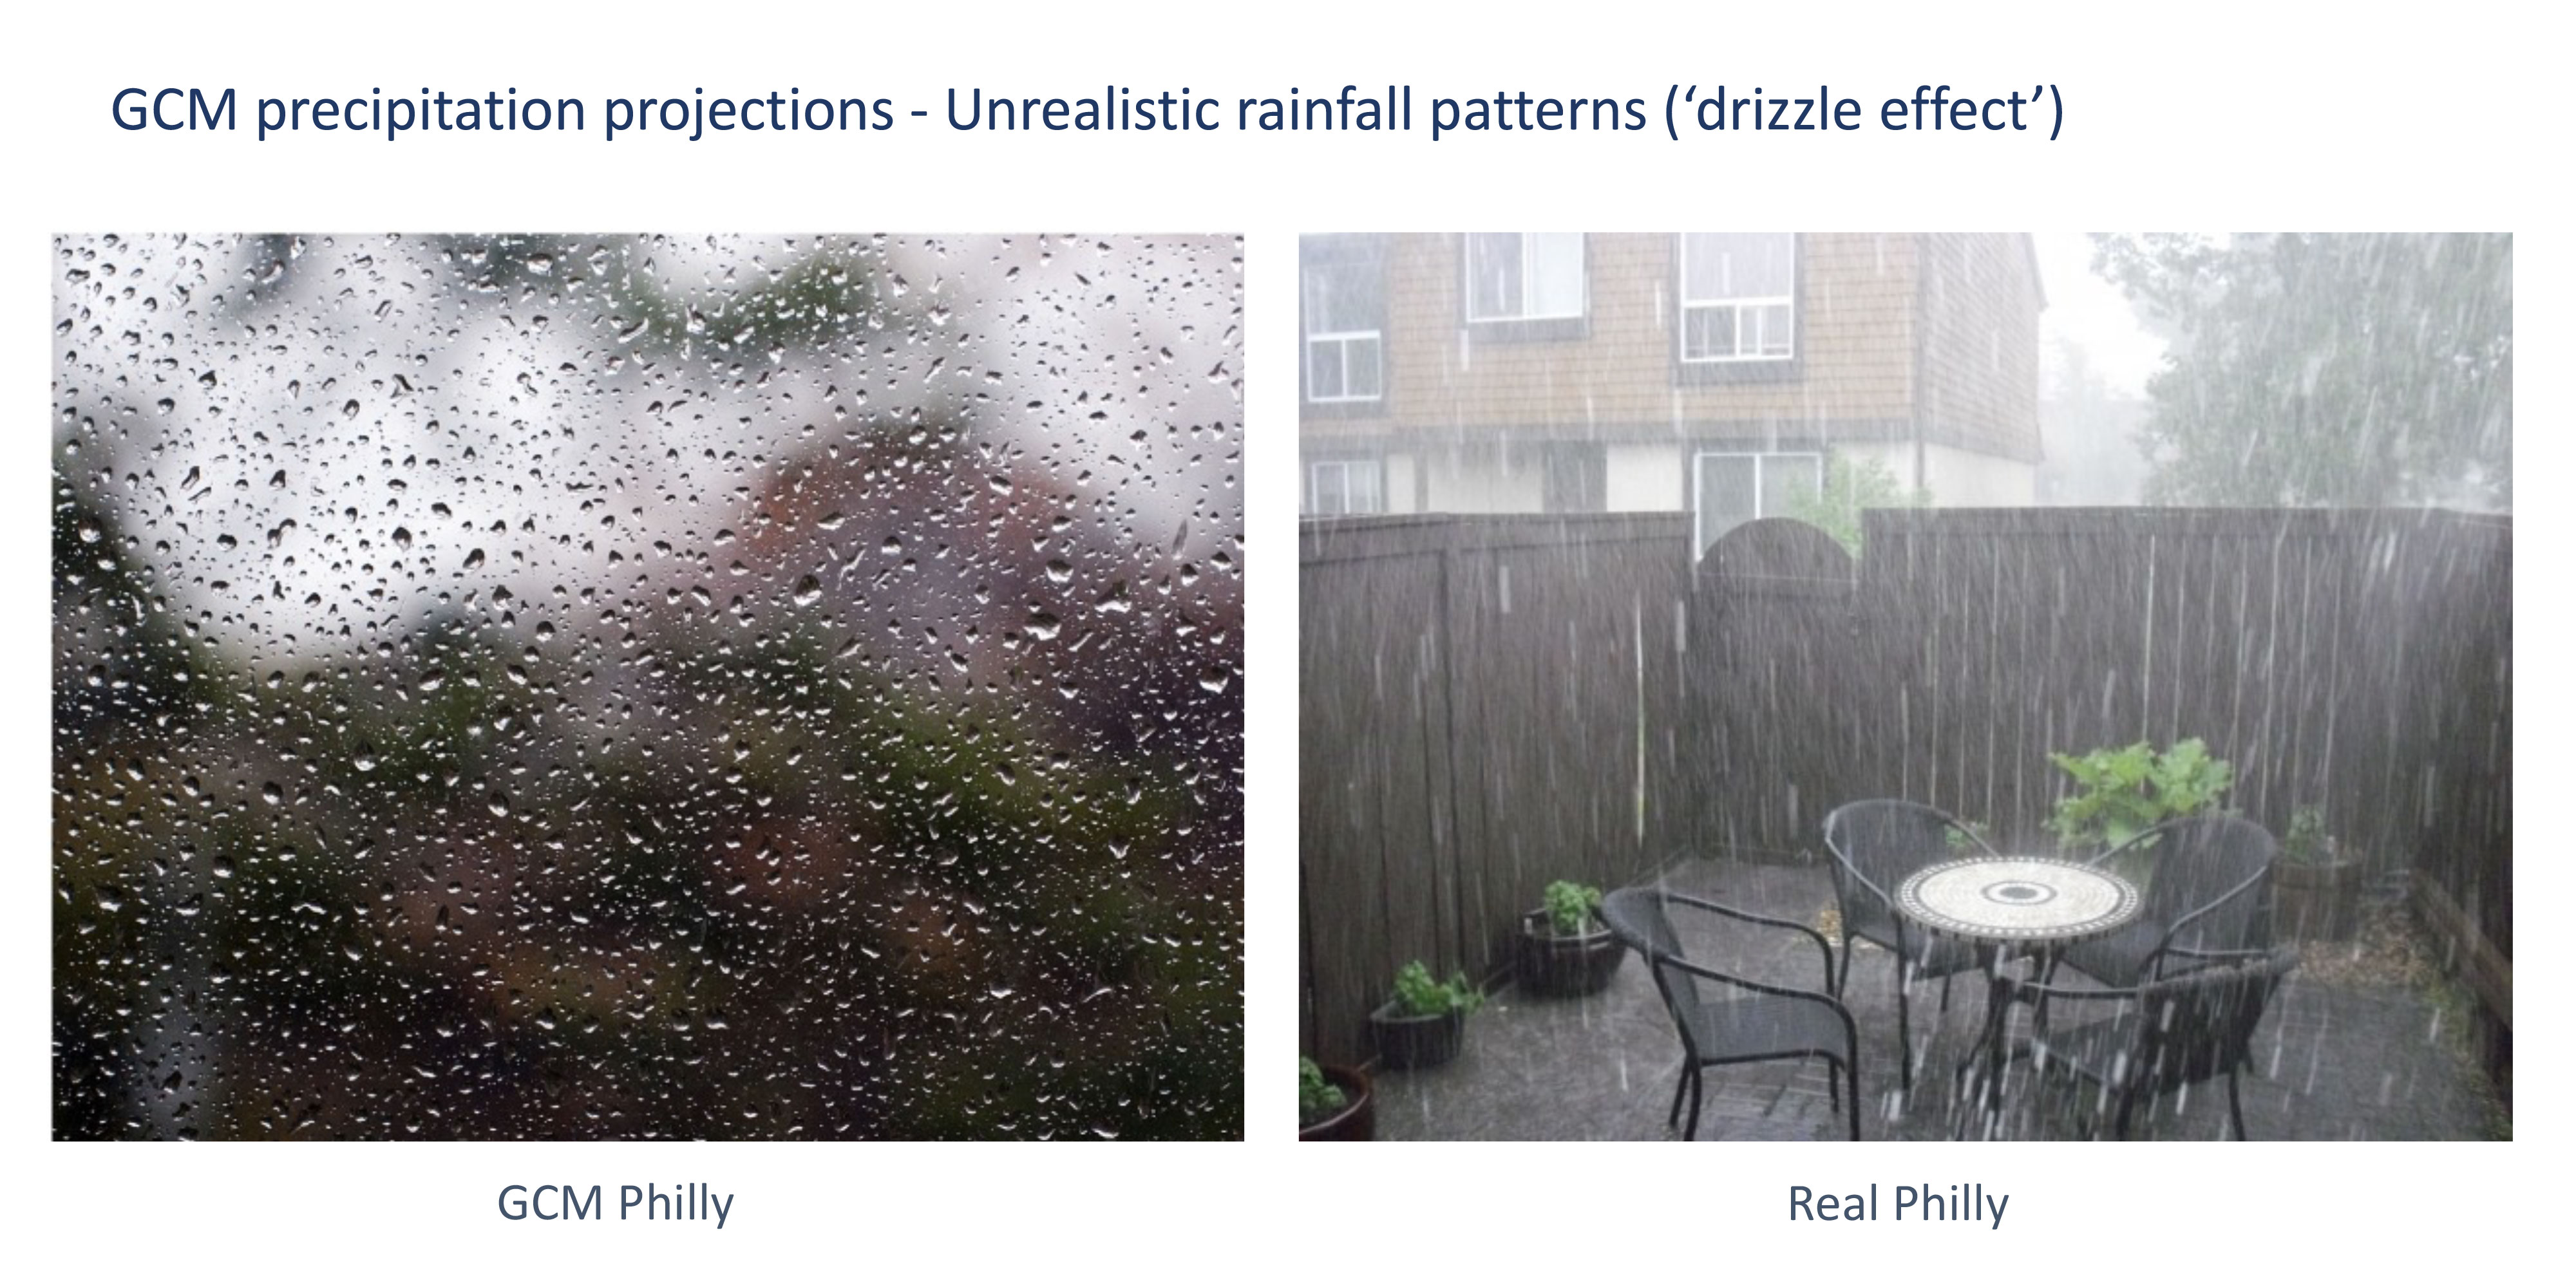
SOURCE: Philadelphia Water Department
![]()
![]()