
CMIP6 Frequently Asked Questions: A Resource for Water Managers
The WUCA CMIP6 Working Group asked the authors to develop a CMIP6 Frequently Asked Questions (FAQ) document for water managers which would assume little or no previous experience with CMIP6 and other climate-model datasets. The goal was to develop a dozen or so highly relevant questions — and clear responses — to aid in the use and interpretation of CMIP6 datasets, with a focus on the contiguous United States.
The FAQs were initially proposed by Working Group members, and then iteratively refined in collaboration with the Working Group, resulting in 13 questions. The document benefited considerably from reviews by the CMIP6 Working Group and by external subject matter experts.
Each question has a "short answer" (1–2 paragraphs) and a "long answer" (2–5 pages), including figures where appropriate, recommendations for further reading, and other references.
View the short answers below, with links to the full document for more detailed answers.
Quick Links & Resources
Frequently asked questions
1. What is CMIP6?
CMIP6 (Coupled Model Intercomparison Project, Phase 6) is the most recent organized international "roundup" of global climate projections from several dozen climate models. The models are run using standardized input scenarios (e.g., of greenhouse gas emissions and other climate drivers) to produce thousands of simulations of past and future climate conditions that get widely used in climate research, assessment, and adaptation planning.
2. How is CMIP6 different from CMIP5, and is CMIP6 better?
CMIP6 differs from CMIP5 in several ways, although these differences do not set CMIP6 completely apart from its predecessors. CMIP6 models generally have higher spatial resolution and greater complexity than their CMIP5 counterparts, although the range in those attributes across the CMIP6 ensemble overlaps with the CMIP5 range (e.g., Figure 2.1). For measures of model performance, general improvements are seen in CMIP6, again with substantial overlap between the CMIP6 and CMIP5 ensembles (e.g., Figure 2.2). CMIP6 does include projections under a greater diversity of emissions scenarios than CMIP5 (8 vs. 4) and includes many more model runs per model/scenario pairing, on average.
As climate modeling continues to develop and mature, the overall improvement represented by a new CMIP has become smaller. CMIP6 is better overall than CMIP5 by many measures, but not by so much as to make CMIP5 obsolete. Depending on the specific use case, there may be compelling reasons to use data from CMIP6 or CMIP5, aside from the qualities of the models themselves.
View the long answer to "How is CMIP6 different from CMIP5, and is CMIP6 better?"
3. What is the CMIP6 hot-model issue, and what are its implications for users?
About one-quarter of the CMIP6 models show greater future warming, given comparable emissions scenarios, than even the hottest-running models in the CMIP5 or CMIP3 ensembles. Most of these "hot" CMIP6 models also simulate recent global warming (1980 to 2015) that is greater than the instrumentally observed global warming over that period. Follow-up studies and other evidence suggest that the very high rate of warming seen in the hot CMIP6 models may be physically implausible.
Due to the inclusion of these hot models, CMIP6 shows substantially warmer projected futures, on average, in nearly all locations globally, including in the U.S., than CMIP5 under comparable emissions scenarios. Several methods have been developed to screen or weight the hot models, reducing their influence, as the IPCC authors did in the latest AR6 reports. However, it is not clear that the hot models' picture of an extremely warm future should be discounted. Also, screening or weighting the hot models may not be appropriate for regional analyses of precipitation and other non-temperature variables. Note that even with the hot models removed, the CMIP6 model ensemble is still somewhat warmer than CMIP5 (see question 7).
4. What are the emissions scenarios in CMIP6 and how do they differ from CMIP5 scenarios?
The CMIP climate modeling approach uses multiple emissions scenarios as model inputs to represent deep uncertainty in the future socioeconomic and policy conditions that will drive the trajectory of greenhouse gas (GHG) emissions and concentrations in the atmosphere over the 21st century and beyond. Each emissions scenario encodes a different degree of anthropogenic influence on the climate (i.e., radiative forcing). Which emissions scenario we end up closest to — and thus the severity of the warming we experience — largely depends on how much additional GHG emissions our collective activities produce. In addition to GHGs, the scenarios specify future changes in land use and anthropogenic aerosols.
For CMIP6, there were eight such scenarios under which the models were run, spanning a broad range of potential future trajectories (Table 4.1). Four of the eight CMIP6 scenarios (SSP1-2.6, SSP2-4.5, SSP4-6.0, and SSP5-8.5) are roughly comparable to the four RCP scenarios (RCP2.6, RCP4.5, RCP6.0, and RCP8.5) used in CMIP5.
5. Which CMIP6 emissions scenarios (SSPs) should be used in an analysis?
The decision of which SSP(s) to use in an analysis should consider several aspects of the scenarios and the intended application, including scenario likelihood, data availability, planning horizon, consistency with previous analyses, and risk tolerance and system vulnerability. Scenario likelihood — which scenarios are more likely to occur, given recent trends in emissions and current policies — is a key consideration for most planning applications. On that basis alone, SSP2-4.5 and SSP4-6.0 would be advisable, followed by SSP4-3.4, with SSP3-7.0 as a potential high-stress scenario. However, there is less output (fewer models/projections) available for SSP4-6.0 and SSP4-3.4 than for SSP2-4.5 and SSP3-7.0. Since the climate outcomes for each SSP increasingly diverge over time, for any analyses focused on later time horizons (~2060 onward) the choice of SSPs is more consequential than for analyses centered earlier in the 21st century.
View the long answer to "Which CMIP6 emissions scenarios (SSPs) should be used in an analysis?"
6. What are Global Warming Levels (GWLs) and how do they correspond to the CMIP6 emissions scenarios?
Global Warming Levels (GWLs) are a relatively new approach for analyzing and communicating regional-to-local climate changes that sidesteps the questions of exactly when those changes might happen and under what emissions scenarios. GWL-based analyses are typically displayed as maps or tables. They show the spatial pattern of projected future changes in a particular variable (e.g., extreme precipitation) that are associated with a particular increment of globally averaged warming, such as +2°C (+3.6°F). GWL-based analyses can provide a versatile framework for risk assessment but may require some adaptation to use in more traditional long-range planning centered on a specific time horizon.
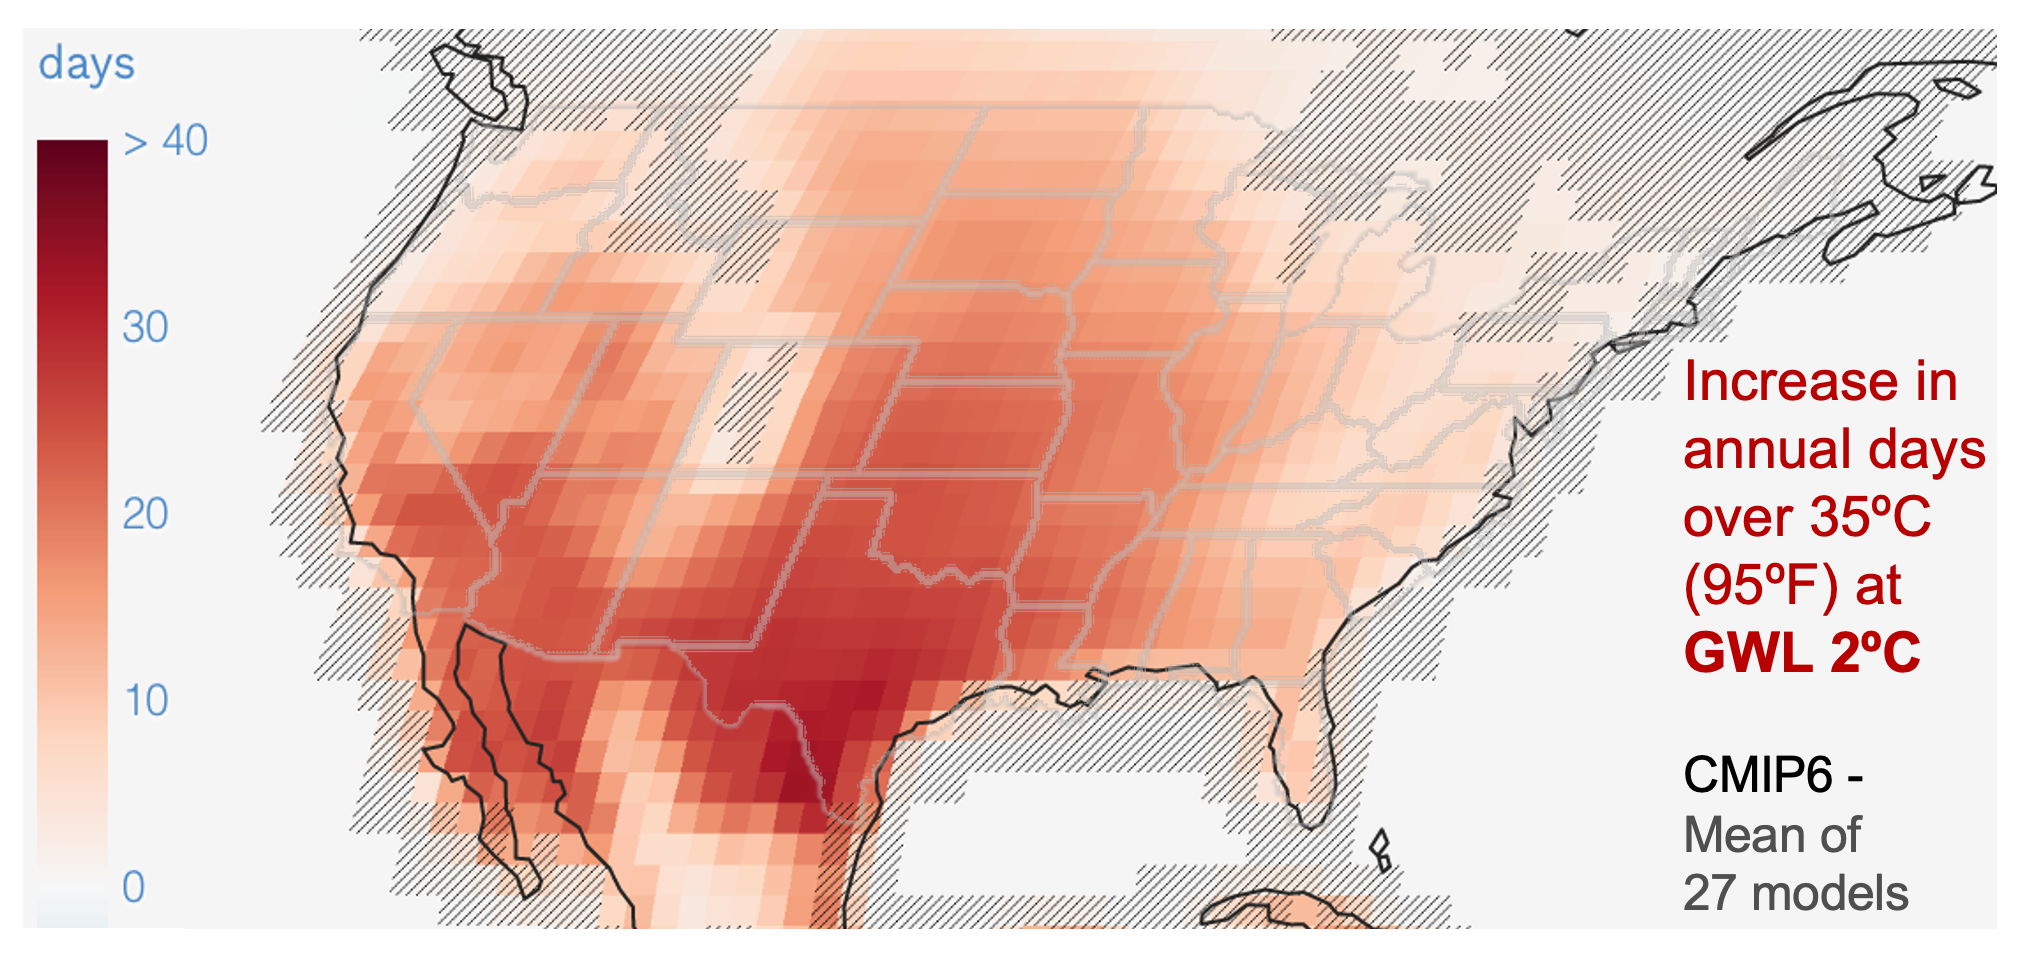
Figure 6.1. Example of a Global Warming Level (GWL) analysis: Projected future increase in the number of days per year over 35°C (95°F) at a GWL of 2°C, based on the mean projection from 27 CMIP6 models. (Source: Modified from IPCC WGI Interactive Atlas)
7. Does CMIP6 show different future climate outcomes for the U.S. than CMIP5, given comparable emissions scenarios?
For projected future temperature and precipitation for the U.S., the differences between the CMIP5 and CMIP6 ensemble means are relatively small compared to the overlap between the two ensembles of global models. The respective spatial patterns of projected temperature and precipitation change for CMIP5 and CMIP6 are also very similar. (Robust comparisons of fine-scale hydrologic changes between CMIP5 and CMIP6 are not feasible with existing datasets as of Fall 2024.)
That said, in the preliminary comparisons, the CMIP6 ensemble mean and median show greater warming for the major U.S. regions than the mean and median for CMIP5. This also holds true for most locations in the U.S., even after screening or weighting models for the hot-model issue (Q3). The differences in projected temperature are large enough that CMIP6-based analyses may show appreciably greater temperature-related vulnerabilities — and potentially greater hydrology-related vulnerabilities as well — than the equivalent CMIP5-based analyses.
8. How does the level of uncertainty in CMIP6 compare with CMIP5?
There are several sources of uncertainty in any set of future climate and hydrology projections at local-to-regional scales (e.g., emissions scenario uncertainty, model uncertainty, natural variability uncertainty). An especially important one to consider in comparing CMIP6 with CMIP5 is model uncertainty, sometimes called structural uncertainty. The model uncertainties in projected future temperature can be characterized by the spread of projected changes across the model ensemble. By this measure, model uncertainties seen in CMIP6 are of similar magnitude to CMIP5, given comparable emissions scenarios and comparably sized model ensembles. However, the total uncertainty in a CMIP6-based analysis of local climate and hydrology changes could differ from the uncertainty in a CMIP5- based analysis for multiple reasons beyond the climate models themselves. Also, consulting a larger number of models will typically reveal greater uncertainty.
View the long answer to "How does the level of uncertainty in CMIP6 compare with CMIP5?"
9. Should CMIP6 or CMIP5 be used in a new analysis? Should existing CMIP5 analyses be updated with CMIP6?
If a new analysis of climate projections is required, then it makes sense to use CMIP6, assuming the desired type and spatial scale of CMIP6-based data are accessible. Downscaled hydrologic model output based on CMIP6, for example, is not yet widely available. It is not usually necessary, however, to update existing CMIP5-based analyses just for the sake of using the latest CMIP projections. That said, updating an analysis to CMIP6 also provides an opportunity to implement enhancements in other data-processing and modeling steps.
10. What CMIP6 datasets are available for visualization and/or download, and where can they be accessed?
The primary Earth System Grid Federation (ESGF) archive of original-resolution (raw) CMIP6 projections is available to any user, but the archive is enormous and challenging to navigate, and the data files are very large. Alternatively, the CMIP6 portals on Amazon Web Services and Google Cloud host the ESGF data files and allow users to perform analyses in the cloud, but these portals require high skill in data handling as well. More manageable partial archives of raw CMIP6 projections are available from three other portals where users can visualize the data prior to downloading, with options for spatial and temporal clipping and averaging of the data.
A handful of higher-resolution, downscaled CMIP6 datasets are also available for global or U.S./North American domains. These are value-added products based on subsets of the primary raw CMIP6 archive and are produced by research groups outside of the CMIP framework. Only one downscaled dataset (LOCA2) is currently accessible through a visualization portal (USGS National Climate Change Viewer; the other datasets are downloadonly). More options for downscaled data are likely to become available soon.
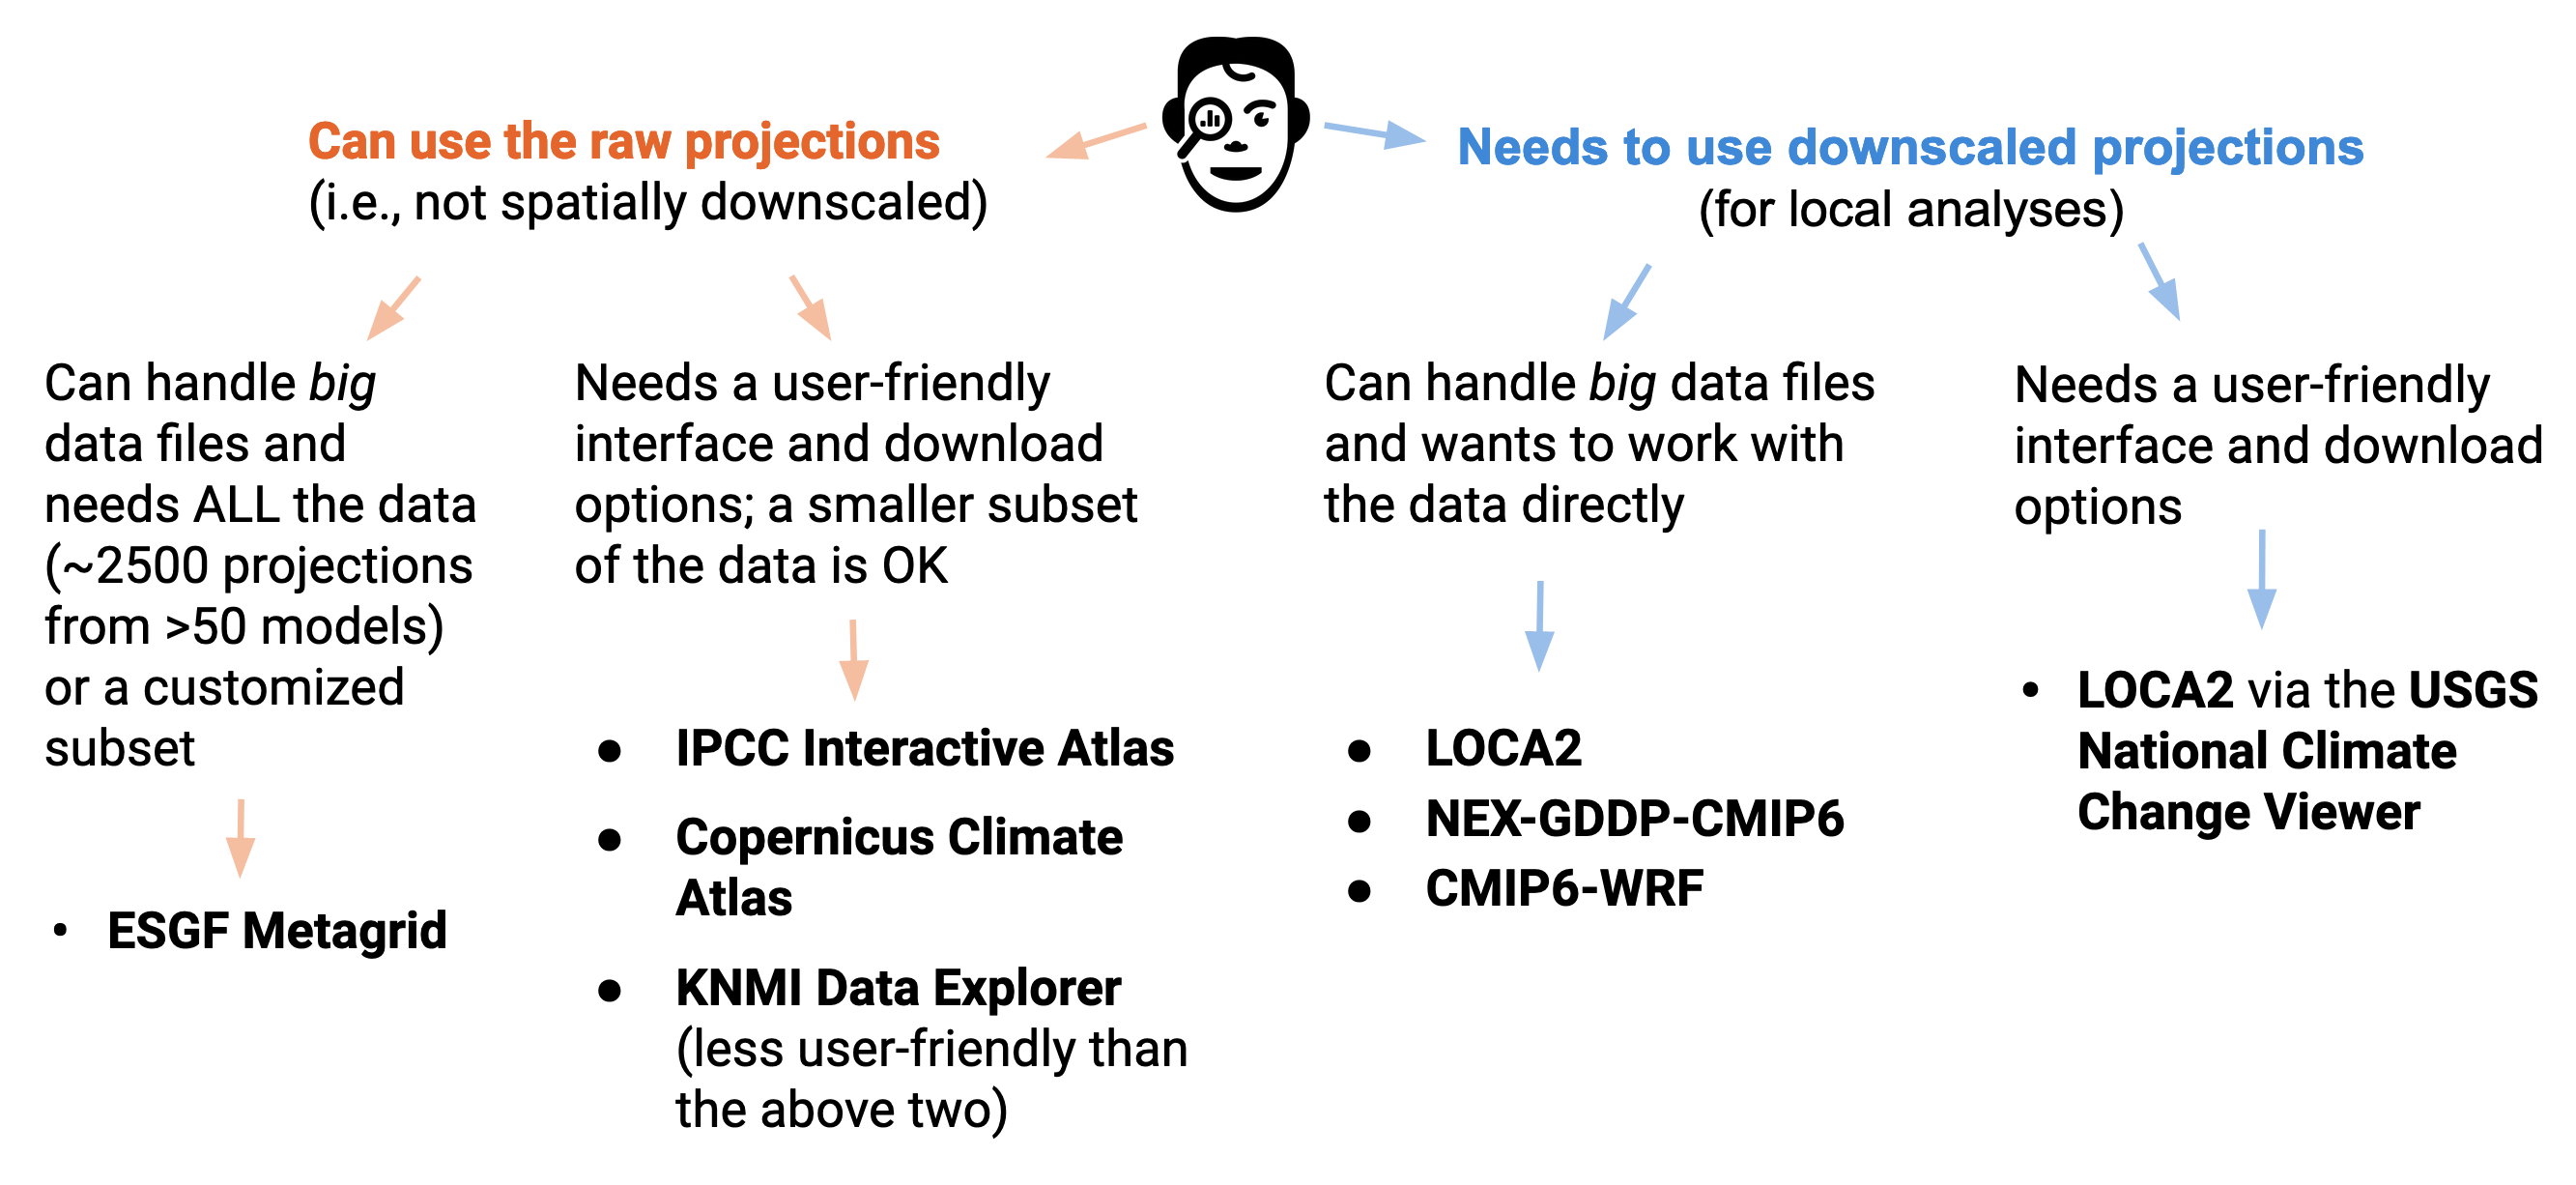
Figure 10.1. Schematic showing selected CMIP6 datasets that are currently available as of Fall 2024, as matched with user needs and characteristics. See “Long answer” below for more details and links to these datasets.
11. What additional CMIP6 downscaling and modeling efforts are in progress? What new capabilities will they provide?
As of Fall 2024, there are several CMIP6 downscaling efforts in progress that once completed will provide new capabilities: variables that are not available from other datasets, expanded visualization and data-handling options, and/or more physically realistic simulation of finescale processes and changes.
12. How can under-resourced communities and water providers best use CMIP6 (and/or CMIP5)? Are there specific resources that enable easier access to, and interpretation of, local or regional climate projections?
When resources are limited, it may be more effective to use those resources to better understand a community’s or water system’s vulnerabilities and impact thresholds, rather than to perform new localized analyses of CMIP projections. Relevant climate change information can often be obtained "off-the-shelf," in climate assessments and similar resources. These resources include interpretation of the projected climate changes alongside curated graphics and key findings and messages.
13. What studies have already been conducted using CMIP6 by or on behalf of water agencies? What was learned about CMIP6?
As of Fall 2024, a handful of research and assessment efforts using CMIP6 have been conducted by or on behalf of water agencies in Oregon, Colorado, and Florida. More studies will be coming out soon.